Sections
Splunk Workload Dashboard
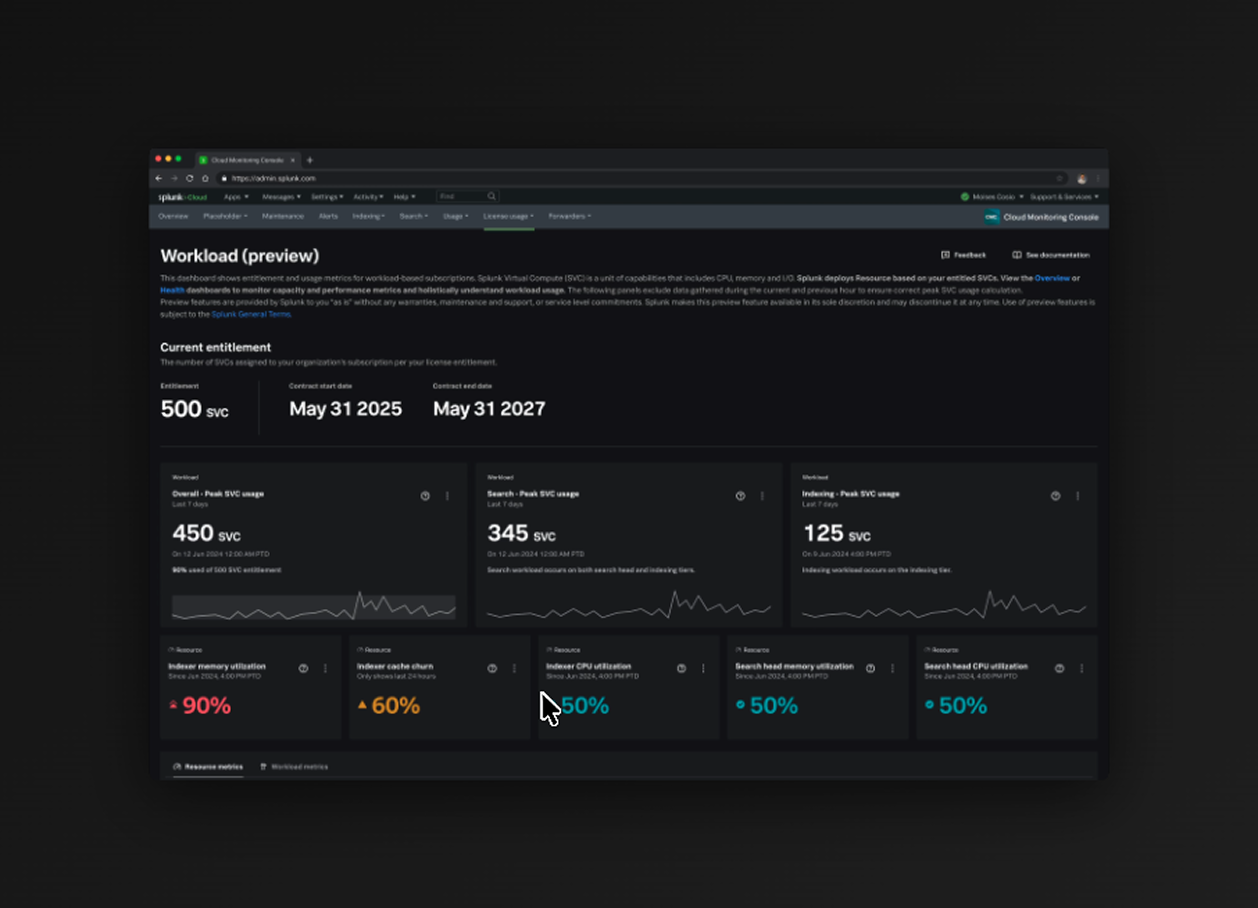
The Workload Dashboard in Splunk's Cloud Monitoring Console (CMC) is one of the core licenses for administrators to monitor and manage their Splunk Virtual Compute (SVC) usage. SVCs represent the compute, memory, and I/O resources that customers purchase as part of their Splunk Cloud Platform licensing.
Role
Product Designer
Timeline
Shipped August 2025
Team
Austin (Design)
Engineers
Product Manager
Skills
Figma
Background
The Workload dashboard is misleading.
The Workload Dashboard had a fundamental disconnect between what was shown to the user and what was actually happening in the users systems. SVC usage is not communicated intuitively, misleading admins' decision making and understanding of where usage is going.
TLDR
- Shipped updates in August 2025 for 1,000+ clients, replacing confusion with transparency in resource visibility.
- Increased dashboard visibility, drastically improving admin workflows' understanding of vCPU, memory, and cache usage for 1600+ stacks.
- Introduced capacity utilization metrics, granular graphs, health indicators, and absolute resource values. Reducing the average time spent on the dashboard by 18% for users.
What are SVCs? (Splunk Virtual Compute): Represent units of compute capacity used to measure and manage the resources consumed by workloads such as searching, indexing, and processing within the Splunk Cloud Platform. They provide visibility into workload utilization and help optimize performance and cost management.
Approach
My Role
I was brought in as the lead designer to redesign the current Workload Dashboard after it had been flagged with poor user feedback. Highlights include a design revamp, mediating user feedback within the team, conducting research while working with PM and engineers.
Research
Research + User Feedback
In this phase I combined information across all team members that have prior feedback from users and conducted additional interviews to fill the information gaps to identify the key patterns.
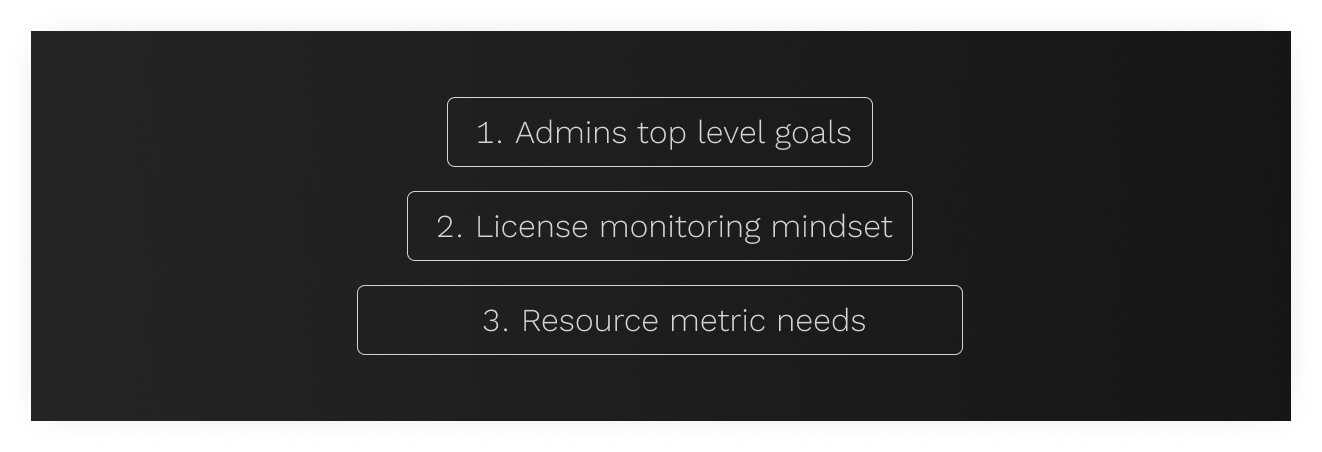
Key Insights Identified
1. Admins want to just know the metric, threshold and capacity. Also where the impact is and what they can do about it.
2. Top-level SVC measurements dominated the view and users fixated on the overall SVC % at the top level without understanding the resource metrics.
3. Graphs lacked clarity, missing important info on the axes and emphasis on what's important.
4. Attribution was unclear, users couldn't easily see where resources were being consumed.
5. No clear status indicators, users couldn't quickly tell if they needed to take action.
Mediating team biases and decision making.
One of the biggest challenges was that team members were making decisions based on their individual experiences with users. It was important to recognize the different goals each team member had and discern the design decisions without biases.
Design
Introducing an Overall SVC Capacity Utilization metric
Including an overall resource capacity utilization card enabled the user to identify any bottlenecks immediately and connect their understanding with the other values.
Replaced misleading Top level SVC metrics and Introduced absolute resource metrics.
Adding percentages of resource metrics clarified the user's holistic understanding of their usage.
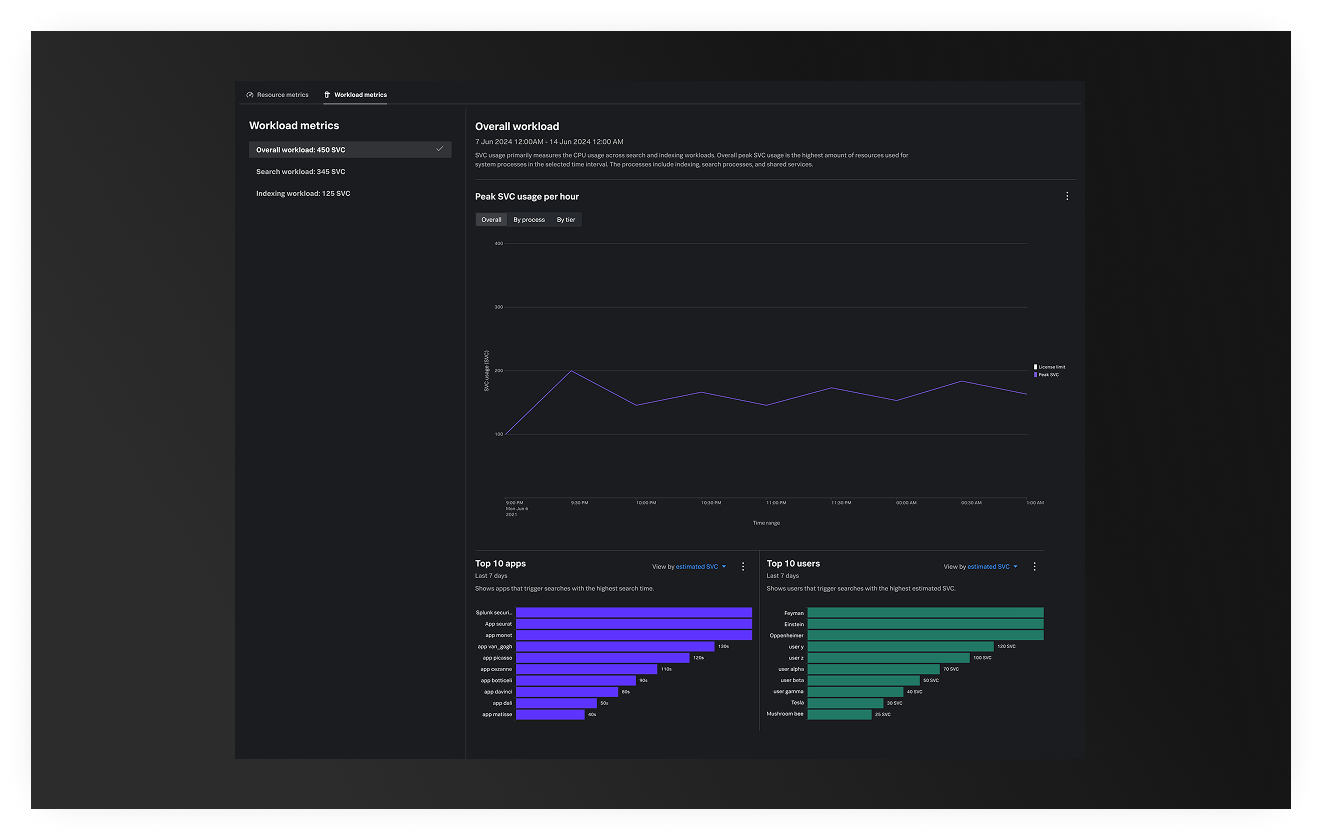
Adding Granular Line Graphs
Helping identify spikes, historical performance and correlated resource consumptions on specific events. I introduced a line graph with markers that helps identify spikes, historical performance and correlated resource consumptions on specific events.
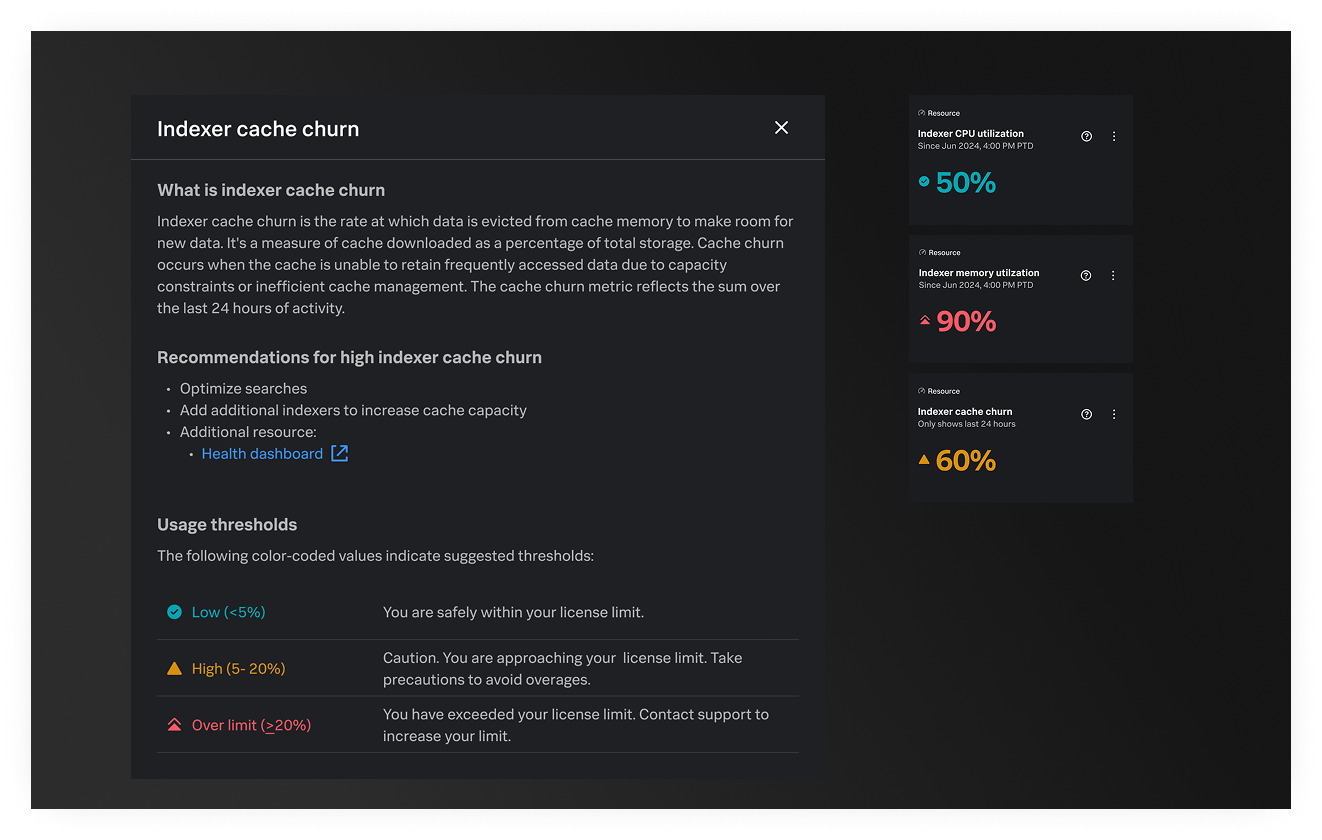
Health and status indicators
To help users quickly assess the health of their usage, a three color indicator was added to help users easily understand the status of usage.
Takeaways
The Impact
The redesigned Workload Dashboard shipped in August 2025 with:
- Absolute resource values added (vCPUs, memory, cache) alongside % utilization
- Overall resource capacity utilization metric highlighting the constraining resource
- Granular line graphs showing resource usage trends over time
- Color-coded status indicators (red/yellow/green) for quick health assessment
- Improved attribution showing where resources are consumed by process, search type, and user
- Removed misleading top-level SVC metrics that caused the most confusion
Reflection
The Workload Dashboard redesign established a new foundation for how Splunk customers understand their resource consumption. By shifting from abstract SVC percentages to transparent infrastructure metrics, admins now have the visibility they need to make informed decisions.
The redesign addressed the core user confusion around "where my SVCs went" by moving from confusion to transparency in licensing and capacity management.